
Introducing Rolling Window Analysis — Capturing the Most Demanding Scenarios of the Game
- Beycin Sport

- Aug 13, 2025
- 3 min read
In elite sports, averages lie. That’s why we’re introducing Rolling Window Analysis — a major new feature within the KINEXON Sports app designed to help S&C coaches, sport scientists, and performance staff move beyond averages and static summaries while capturing what matters most: the most demanding moments of play.
With our LPS, IMU, or GPS-based systems, Rolling Window Analysis lets you quantify the highest performance demands in real-time, enabling precise, sport-specific load profiling that’s aligned with the latest evidence from sports science.
Why It Matters: The Evidence Is Clear
A recent study by Irid et al. (2025), published in Biology of Sport, emphasized how traditional averages drastically underestimate peak intensity periods in basketball. Using KINEXON LPS and IMU devices, researchers analyzed 31 elite youth athletes over 40 official games and found:

“Shorter time epochs consistently captured higher peak demands across all performance variables for both male and female players.” – Irid et al. (2025)
Peak distance covered, accelerations, decelerations, and sprint durations all declined significantly as the analyzed time window increased — showing that key moments of overload can be easily missed when using traditional averages or static time blocks.
These findings underline a core truth: training and monitoring must also reflect the most demanding scenarios (MDS), not just session averages.
Exploring Rolling Window Analysis
Rolling Window Analysis enables exactly that — by giving users a moving, high-resolution lens on performance intensity over configurable time windows.
Widget Features:
Window Length (e.g., 30s): Set the snapshot duration for performance evaluation
Window Shift (e.g., every 2s): Controls the step size between windows
Key Value (e.g., 70m in 30s): Defines thresholds for “high demand” exposures
Window Range: Apply analysis to the full session or specific periods
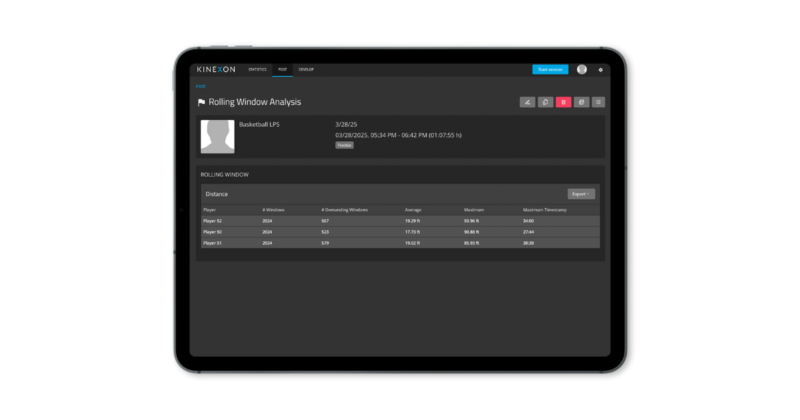
Output Includes:
Total number of windows
Number of high-demand windows (dependent on user set key value)
Average & maximum window value
Timestamp of peak intensity
Exportable to CSV or Excel
Practical Implications Backed by Research
Irid et al. applied rolling averages over 10, 30, 60, and 120 seconds and showed that relative performance drops by over 50% when comparing the shortest to longest windows. For example:
Male players: Distance dropped from 251.3 m·min⁻¹ (10s) to 113.6 m·min⁻¹ (120s)
Female players: Accelerations dropped from 12.99 to 2.44 per min from 10s to 120s windows
These findings validate that shorter windows reveal the highest, most relevant demands — precisely what Rolling Window Analysis is designed to detect.
Furthermore, the study showed position-specific differences in demands:
Backcourt players consistently showed higher PD across most variables
Frontcourt players were more frequently exposed to HIP and VHIP for total distance in shorter epochs
This reinforces how Rolling Window Analysis can inform individualized and role-specific training programs.
Use Cases for Coaches & Sport Scientists
Sprint & Acceleration Exposure: Quantify how often and when athletes hit thresholds during gameplay or drills.
Max Load Monitoring: Know each athlete’s highest intensity period — and build return-to-play plans around real in-game benchmarks that reflect the most demanding scenarios.
Position-Specific Demands: Tailor workloads to reflect the different peak demands seen in guards vs. forwards vs. bigs.
Session Design Validation: Did your drill create enough high-intensity windows? Now you can measure that.
From Research to Practice
The Irid et al. study highlighted the critical need for dynamic, rolling data to capture peak demands for athletes during games and practices. Rolling Window Analysis brings this to your fingertips.
Whether you’re working in professional basketball, soccer, american football, volleyball, hockey, or elite youth environments, you now have access to cutting-edge methodology that mirrors what the top researchers in the world are using to profile peak demand.
Available Now
PERFORM LPS (Local Positioning System)
PERFORM IMU (Inertial Measurement Units)
PERFORM GPS-based monitoring
To activate it or learn more, contact us or explore the widget directly in your session dashboard.


Comments